Market Model
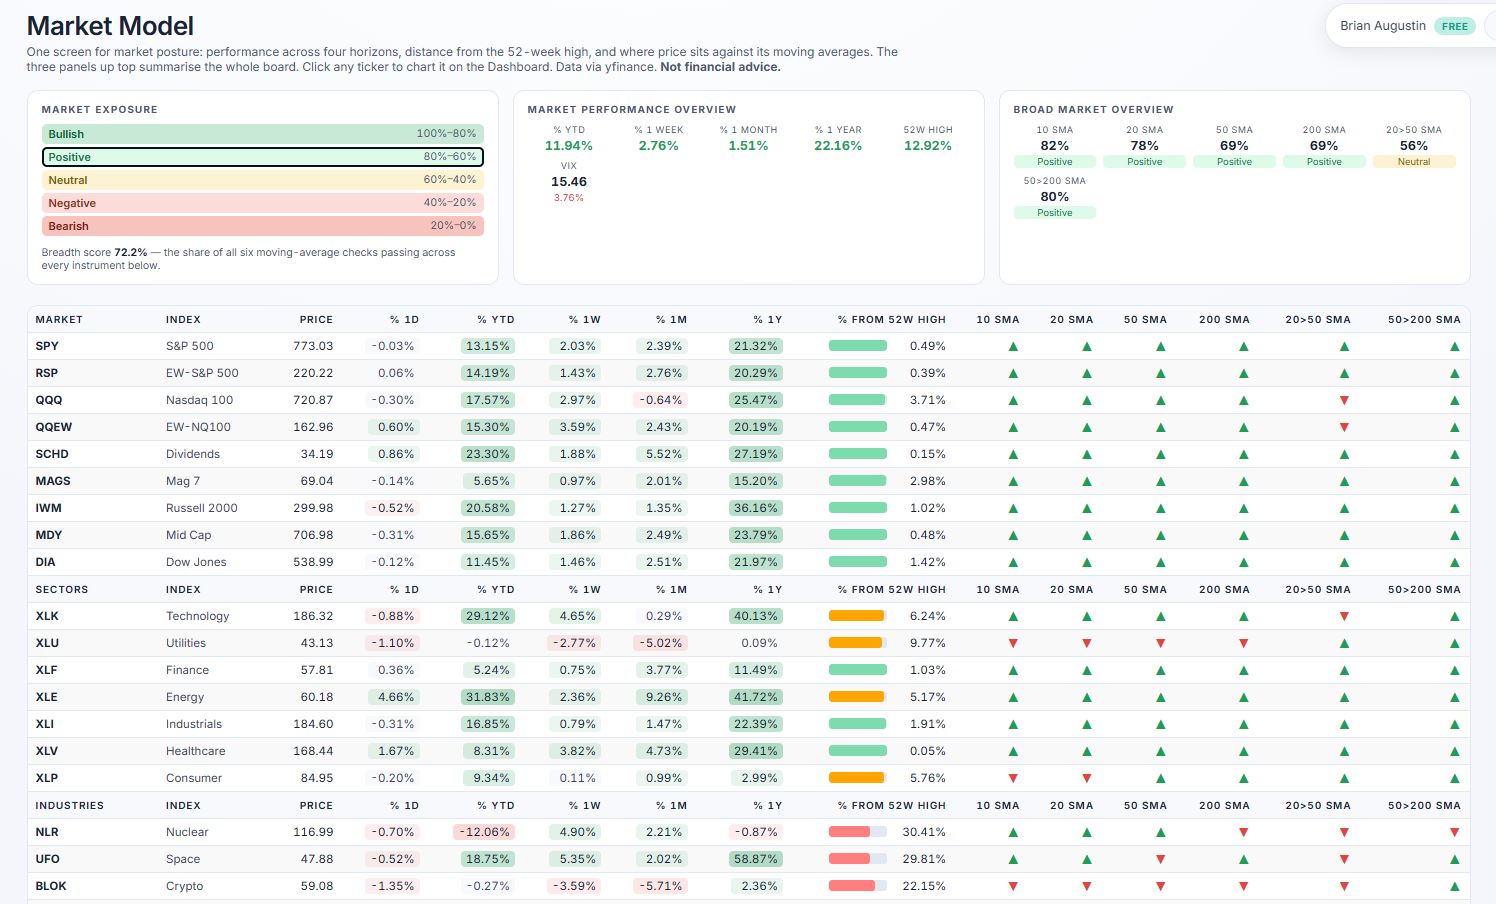
One screen for market posture: performance across four horizons, distance from the 52-week high, and where price sits against its moving averages. The three panels up top summarise the whole board. Click any ticker to chart it on the Dashboard. Data via yfinance. Not financial advice.
Market Exposure
Market Performance Overview
Broad Market Overview
What each column means
Market Dashboard
Pick a market from the tabs, then any row in the list — the chart above follows. Drag the chart to scroll back through history and scroll to zoom; it keeps going back to the instrument's first day of trading. Data via yfinance. Not financial advice.
drag to scroll · scroll to zoom · double-click to reset
Your whole market view, one workspace.
Score any stock on six weighted factors, price every contract in its option chain, and track what you actually own — cost basis, concentration and risk included. One engine, from first screen to open position.
Free to use · an account is only needed to save positions
Portfolio · today
Market value $128,400 +$1,204
See it in action
The actual screens, not mockups
Every image below is the live product. Click any one to open it full size.




Portfolio
See what you actually own, not just what you watch
A watchlist tracks curiosity. A portfolio tracks exposure. Enter shares and average cost once and Tradesify keeps the rest current — market value, unrealized gain, today's move, and whether the scoring engine still likes what you are holding.
- ✓ Several books — taxable, retirement, paper — each with its own address and cash balance
- ✓ Import a positions CSV straight from your broker
- ✓ Sector and industry weights by dollar value, not ticker count
Allocation · by sector
Stock screener
Six factors, one weighted score — and the reasons behind it
Growth, quality, valuation, financial health, momentum and technicals, each weighted and combined into a single composite. Hover any grade and the model shows its working: which inputs helped, which hurt, and which were missing.
- ✓ Load a ticker list, a theme, a sector or an industry
- ✓ Six views over the same names — ranking, charts, scatter, stats
- ✓ Fixed, published models — no black box, no hidden tuning
Why this grade
NVDA · A · 88 / 100
Option chain
Every contract priced, then ranked on what the trade needs
The full chain, priced with Black‑Scholes and scored on liquidity, breakeven, decay and convexity. Filter by expiry and delta band, then read the Greeks without exporting anything to a spreadsheet.
- ✓ Long calls and puts ranked by setup quality, not just volume
- ✓ Breakeven, days to expiry and theta drag shown per contract
- ✓ Implied volatility history so today's premium has context
Long calls · 45 DTE
Risk & performance
Find out when your diversification is only skin deep
Twelve tickers can behave like two positions. Tradesify correlates your holdings on weekly returns, charts the years that went for and against you, and reports drawdown and volatility against a benchmark — so concentration shows up before it costs you.
- ✓ Correlation heatmap that names the pairs moving as one
- ✓ CAGR, volatility, max drawdown and return per unit of risk
- ✓ Calendar-year bars, green for gains and red for losses
Return by calendar year
Themes & sectors
Start from an idea, not a blank ticker box
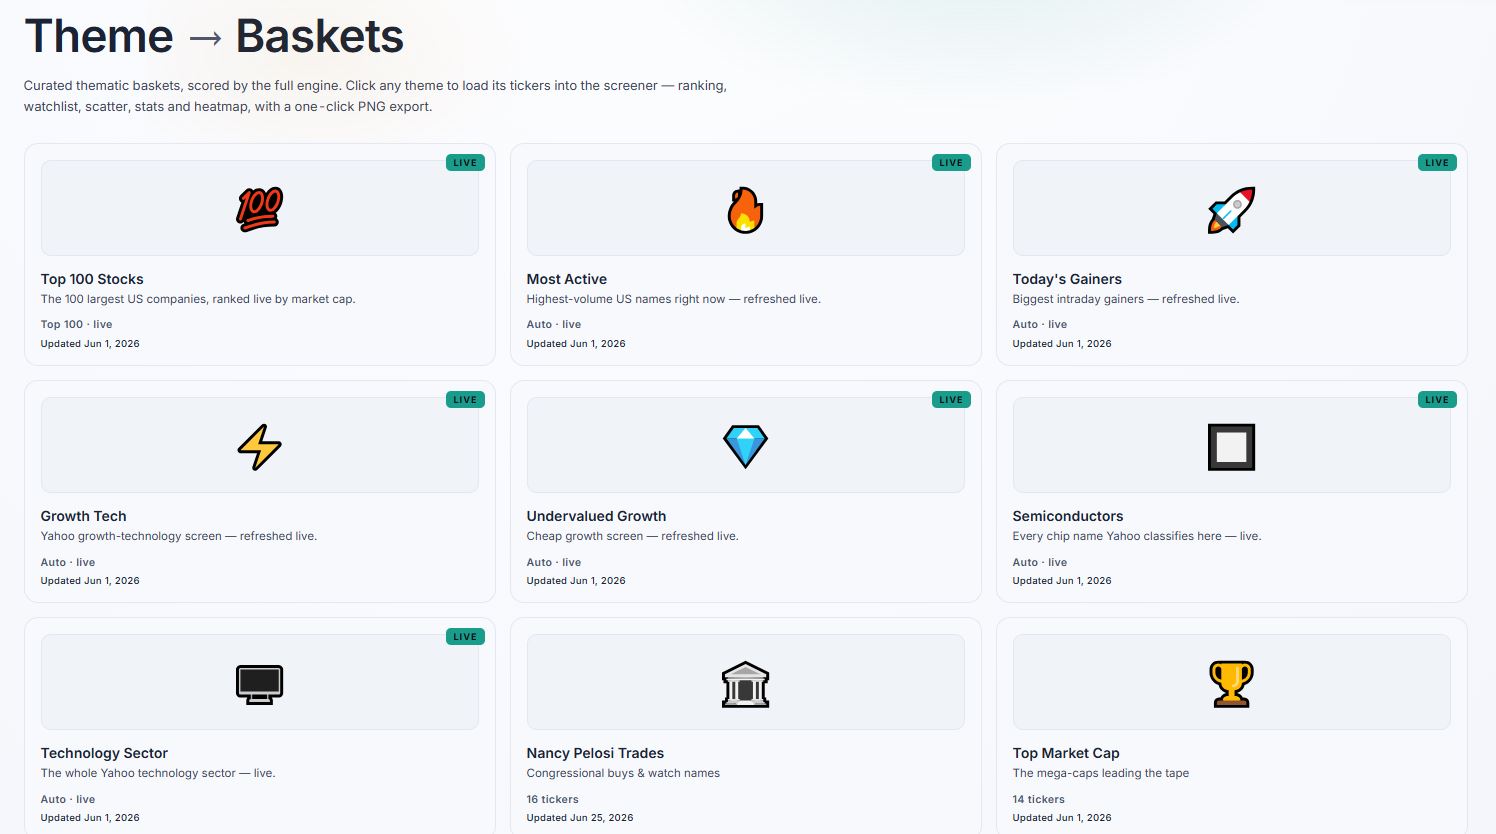
Forty curated themes, eleven sectors and 312 industries, each one loading straight into the screener already scored. Or open the heat map and read where money moved today, this month and this year.
- ✓ Top 100 by market cap, refreshed live
- ✓ Industry heat map across every sector at once
- ✓ Publish a scorecard to the leaderboard when you want to share one
Industry heat map · 1M
Everything else
The details that make it usable daily
Small things, but they are the difference between a tool you try once and one you keep open.
Downgrade alerts
A notification when the engine lowers a grade on something you hold — once, when it happens, even with the site closed.
Broker CSV import
Drop a positions export from Fidelity, Schwab, Robinhood or E*TRADE. You see exactly what it read before anything is saved.
Six views, one dataset
Ranking, charts, scatter, statistics, comparison and valuation — over whatever names you just loaded.
Compare, three ways
A rebased performance chart with a crosshair read-out, the scoring radar, and a Finviz-style ranking grid of 85 metrics — up to 30 tickers side by side.
Options and ETF look-through
Contracts priced off the chain with Greeks in position terms, and index funds decomposed into the sector weights you actually hold.
Every metric, explained
Hover any figure on a stock page for what it means and where it misleads. Export the lot — definitions included — to Excel.
A rating that shows its work
Not just a grade: which factors earned points, out of how many, and whether the analyst consensus agrees or doesn't.
Headlines, linked out
The last five days for any ticker — date, headline, source, straight to the publisher. Titles only, never scraped article text.
Public scorecards
Publish a scored list as a shareable page, or read what other people have put up on the leaderboard.
Sector divergence
Where a sector's average and its leaders disagree — usually the first sign of rotation inside it.
Light and dark
The whole app follows one switch, saved to your browser. No separate themes to keep in sync, no flash on load.
How it works
Three steps, no setup
No API key, no data subscription, no spreadsheet to maintain.
Load some names
Type tickers, pick a theme, or open a sector. Everything arrives scored on the same six factors, so the numbers are comparable across whatever you loaded.
Read the model, not just the rank
Every grade opens up into the inputs behind it. Where data was missing, the model says so rather than quietly filling the gap.
Track what you act on
Add positions to a portfolio and the same engine keeps scoring them — with cost basis, concentration and correlation alongside.
Anywhere
Works on whatever you have open
One responsive web app — nothing to install, and your account carries your portfolios between devices.
Score a name, then scan its chain
Start with a handful of tickers and see the whole workflow in about a minute. An account is only needed when you want to save positions.
Tradesify · Stock Scorecard
Ticker → Scorecard
Type a ticker or a list of tickers below. Each is scored on a six-category weighted fundamental model plus an EMA/RSI technical structure read. Data is fetched live via AI-powered web search — no API key needed on your end.
Not financial advice. Tradesify is a screening and research tool, not investment advice or a recommendation to buy or sell any security.
Enter ticker(s)
Comma or space separated · e.g. AAPL, MSFT, NVDA · already have a list loaded? Type more and click Fetch & Score again to add them — use the × on a row to remove one.
Data fetched live via yfinance (Yahoo Finance) — local backend required.
| # | Ticker | Company | Price | Mkt Cap | % 1D | Score | Comp ▾ | Bear–Bull | F/T | D-RSI | Posture | % YTD | Chart 1Y | % 1Y | △ Highs | 20 | 50 | 200 |
|---|